Tag: ML

  • Why Tanh is a better activation function than sigmoid ?

    You might be asked that why often in neural networks, tanh is considered to be a better activation function than sigmoid.

    Sigmoid
    Tanh

    Andrew NG also mentions in his deep learning specialization course that tanh is almost always a better activation function than sigmoid. So why is that the case?

    There are a few reasons why the hyperbolic tangent (tanh) function is often considered to be a better activation function than the sigmoid function:

    1. The output of the tanh function is centered around zero, which means that the negative inputs will be mapped to negative values and the positive inputs will be mapped to positive values. This makes the learning process of the network more stable.
    2. The tanh function has a derivative that is well-behaved, meaning that it is relatively easy to compute and the gradient is relatively stable.
    3. The sigmoid function, on the other hand, maps all inputs to values between 0 and 1. This can cause the network to become saturated, and the gradients can become very small, making the network difficult to train.
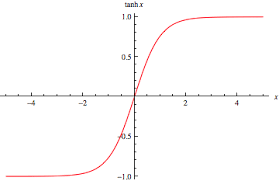
    4. Another reason is that the range of the tanh function is [-1,1], while the range of the sigmoid function is [0,1], which makes the model output values more similar to the standard normal distribution. It will be less likely to saturate and more likely to have a good gradient flow, leading to faster convergence.
    5. Another advantage is that the tanh function is differentiable at all points. In contrast, the sigmoid function has a kink at 0, which may cause issues when computing gradients during back-propagation, and other optimization methods.

    All that being said, whether to use sigmoid or tanh depends on the specific problem and context, and it’s not always the case that one is clearly better than the other.

  • When to use F2 or F0.5 score ? (F-beta score)

    Whenever we come across an imbalanced class problem, the metric to measure is often F1 score and not accuracy. A quick reminder that the F1 score is the harmonic mean of precision and recall.

    Precision is how accurate is your ML model in its predictions.

    Recall is a measure of the model’s ability to correctly identify the positive class.

    So the F1 score is a balanced measure of both recall and precision. But what if you want to prioritize reducing false positives or reducing false negatives, there comes F-beta. It’s a generalized metric, where a parameter beta is introduced to generalize the F-score.

    This enables one to choose an appropriate beta value to tune for the task at hand. If you want to minimize false positives, you want to increase the weight of precisions, so you should choose a value of beta less than 1, typically 0.5 is chosen and is called F0.5 score.

    Similarly, if you want to increase the importance of recall and reduce false negatives, you should choose a value of beta greater than 1, typically 2 is selected and is called F2 score.

    In a nutshell, you should optimize F2 score to reduce false negatives and F0.5 score to reduce false positives.

  • Oddball Data Science Interview Questions on Decision Trees

    Decision trees are the building blocks of most ML models. So often questions regarding Decision Trees are asked in data science interviews. In this post, I’ll try to cover some questions which are asked during data science interviews but often catch people by surprise.

    Are Decision Trees Parametric or non-parametric models ?

    Decision Trees are non-parametric models. Linear Regression and Logistic regression are examples of parametric models

    Why is Gini Index preferred way of growing decision trees than Entropy in Machine Learning libraries ?

    The calculation for Gini Index is computationally more effecient than that for Entropy.

    It’s because of this reason that it is the preferred way

    How are continouis variables handled as predictor variables in decision trees ?

    Continuous or numerical variables are binned and then used for splitting a node in Decision tree

    What is optimised in case the target is a continuous variable or when the task is Regression ?

    Variance reduction is used to choose the best split when the target is continuous.

    How do decision trees handle multiple classes or in other words does multi-class classification ?

    The split is done on Information gain like in case of binary classifier using Gini or Entropy. In the leaf where no further splits are possible, the class having the highest probability is the predicted class. You can even return the probability as well.

  • What is Heteroscedasticity and How do we Test for it ?

    Once your linear regression model is trained, you should always plot your residuals (y – ŷ) whether the errors are homoscedastic or heteroscedastic. What do we mean by these terms? It means that there should not be any pattern in residuals and they should be uniformly distributed, or in other words, there should not be any variance in the residuals. Homoscedasticity is one of the assumptions of linear regression, so it is often important to check for it.

    source: Wikipedia
    source: Wikipedia

    In the above figures, you can clearly see that the residuals have a clear pattern in the heteroscedastic image. In that scenario, you cannot rely on the regression analysis.

    How to test for heteroscedasticity?

    There are many ways to test for heteroscedasticity, I’ll list a. few ways here –

    1. Visual Test – Just look at the residual plot and you’ll often see whether the residuals have any variance or not, not very accurate but often works.
    2. Bartlett test
    3. Breusch Pagan test
    4. Goldfeld Quandt test
    5. Glesjer test
    6. Test based on Spearman’s rank correlation coefficient
    7. White test
    8. Ramsey test
    9. Harvey Phillips test
    10. Szroeter test
    11. Peak test (nonparametric) test

    All these tests in one way or another try to reject the null hypothesis H0 : variance is constant and the alternative hypothesis is that Ha : variance is not constant. You can go into detail about the tests here.

  • Importance of VIF in Linear Regression

    What is VIF

    Variance Inflation Factor (VIF) determines the multicollinearity amongst the independent variables (predictors). Multicollinearity is when there is a high correlation between your predictor variables, usually 0.8 or higher. This can adversely affect your regression analysis.

    How is it calculated?

    VIF of a predictor variable is calculated by regressing it against all other predictor variables. This gives the R2 value which can be plugged into this formula

    This will give the VIF value of a predictor.

    • VIF = 1, not correlated
    • VIF < 5, slightly correlated
    • VIF > 5, highly correlated

    These values are just guidelines and how high acceptable VIF values are depends on the problem statement.

    If you don’t want to use VIF and have very few predictor variables, one can plot a correlation matrix and remove the highly correlated variables.

    You might also wonder why do we calculate the p-value of predictor variables in Linear regression. Find out why here.

  • Null Hypothesis of Linear Regression Explained

    Ever wondered why we look for p-value less than 0.05 for the coefficients when looking at the linear regression results.

    Let’s quickly recap the basics of linear regression. In Linear Regression we try to estimate a best fit line for given data points. In case we have only one predictor variable and a target the linear equation will look something like

    Y = A + Bx

    Here A being the intercept and B being the slope or coefficient.

    The null hypothesis for linear regression is that B=0 and the alternate hypothesis is that B != 0.

    This is the reason why we look for p-value < 0.05 to reject the null hypothesis and establish that there exists a relationship between the target and the predictor variable.